Seoul Keeps Rising, but Gangnam Starts to Fall!
Seoul Keeps Rising, but Gangnam Starts to Fall!

Hello, this is Treasurer.
Seoul apartment prices have risen for a record 86 consecutive weeks, surpassing the previous record of 85 weeks under the Moon Jae-in administration.
Prices rose 0.09% in the fourth week of September, bringing the cumulative increase to 17.6%—more than double the previous administration’s 7.7%. Since the Lee Jae-myung administration took office, prices have climbed 15.3% over 68 consecutive weeks.
Is the Pace of Growth Slowing?
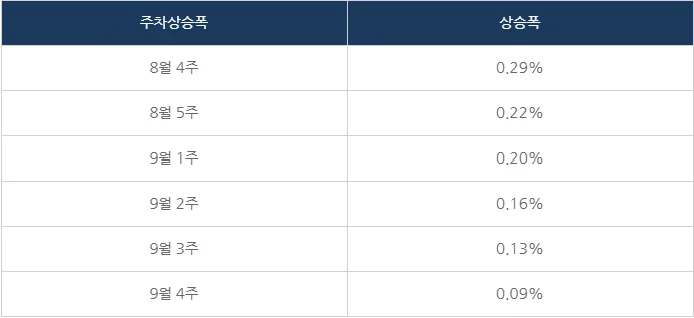
Despite the overall increase, an important change is emerging beneath the headline figures: the weekly rate of growth has slowed for five consecutive weeks.
Since the fourth week of August, the rate of increase has gradually declined, falling below 0.1% and approaching a near-flat level. In other words, Seoul apartment prices are still rising overall, but the pace of growth is clearly losing momentum.
*A near-flat market refers to a situation in which prices remain largely unchanged, with only minimal fluctuations.
Gangnam’s “Three Districts” Enter a Downturn
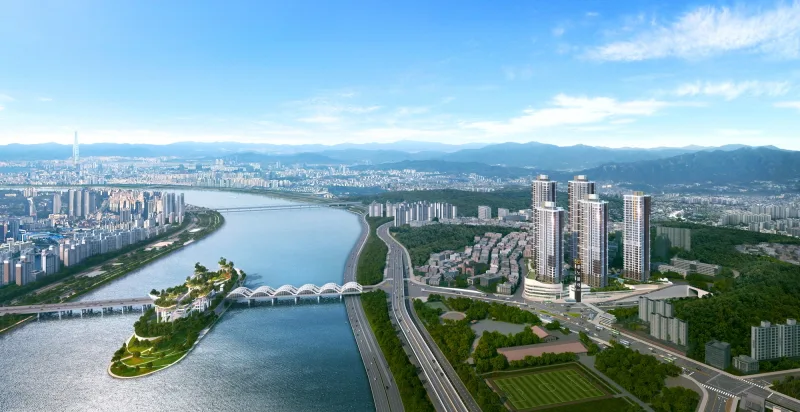
The most notable development is the performance of the three major Gangnam districts—Gangnam, Seocho, and Songpa.
Following the August 3 tax reform package, prices in these high-value housing markets have continued to decline amid concerns about higher holding taxes and capital gains taxes.
- Gangnam District: -0.56%, down from -0.42% the previous week.
- Seocho District: -0.33%, marking eight consecutive weeks of decline.
- Songpa District: -0.19%, marking four consecutive weeks of decline.
Gangnam District has declined for eight consecutive weeks, along with Songpa District recording its sharpest decline in the latest several weeks.
Yongsan District, a key area along the Han River, also fell by 0.01%. This marked its first decline in 22 weeks, since the fourth week of April.
As a result, the number of districts experiencing falling prices in Seoul has increased to four.
Will the Downturn Spread to Mapo, Yongsan, and Seongdong?
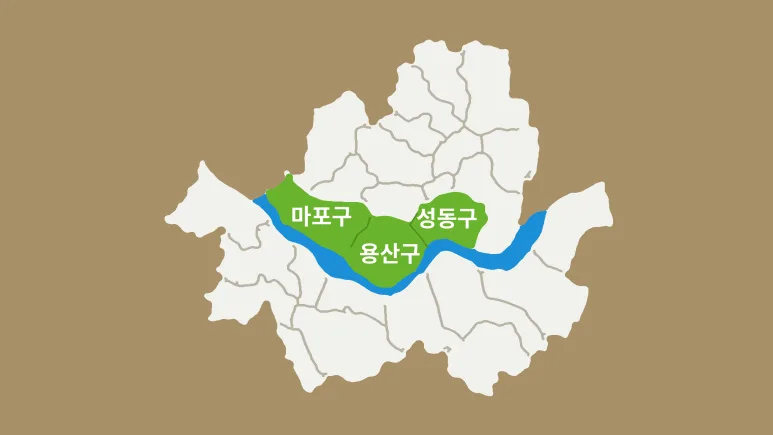
The key question is whether weakness in the three Gangnam districts will spread to the so-called “Mayongseong” area-Mapo, Yongsan, and Seongdong.
Seongdong District saw its weekly increase slow from 0.12% to 0.07%, while Mapo District recorded a modest 0.08% gain. Both areas are showing early signs of adjustment.
For now, these developments appear to represent the initial stages of a broader trend. However, with the decline in the three Gangnam districts continuing for eight weeks, the slowdown in neighboring Han River districts warrants close attention.
Gangnam Falls While Northern Seoul Rises
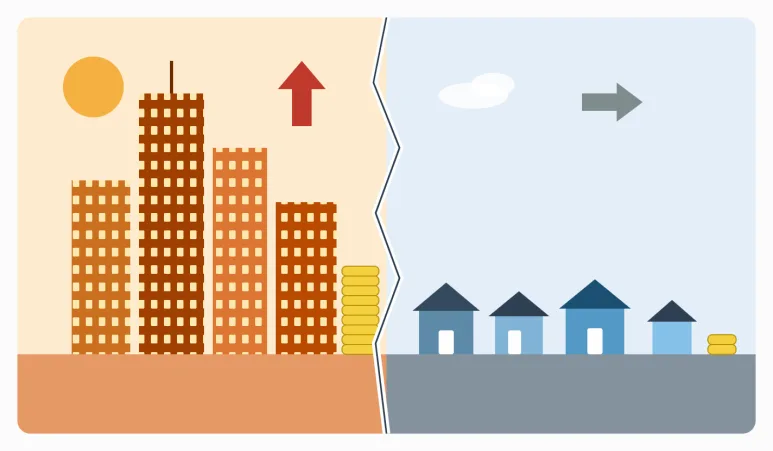
The decline in Seoul’s three Gangnam districts contrasts with continued growth in lower-priced
areas in the north. Seodaemun recorded the city’s largest weekly increase at 0.41%, followed by Seongbuk and Dongdaemun at 0.36%, Nowon at 0.34%, and Gangbuk at 0.31%.
Year to date, Gangnam was the only district among Seoul’s 25 districts to post negative growth,
falling 0.26%, while Seongbuk, Seodaemun, and Nowon rose 14.87%, 12.40%, and 11.51%, respectively.
This divergence reflects a polarized market: high-end housing is adjusting under heavier tax burdens, while strong demand from actual buyers continues to support lower- and mid-priced properties.
Key Variables for the Fourth Quarter

The two most important variables for Seoul’s real estate market in the fourth quarter are interest rates and the effectiveness of the tax reform package.
Seoul apartment prices are still rising overall.
However, the high-value housing market centered in the three Gangnam districts has already
entered a downturn following the tax changes, and early signs suggest that this weakness may
be spreading to Yongsan and other areas along the Han River.
Meanwhile, continued demand from actual buyers in northern Seoul is supporting the citywide increase.
Monitoring the Market with AlphaLenz
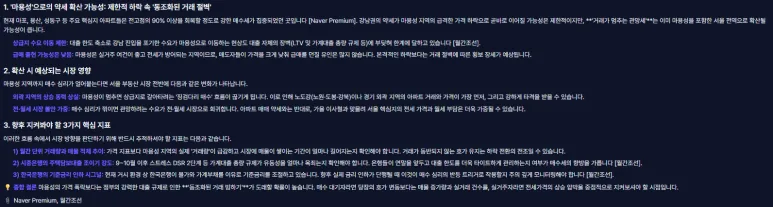
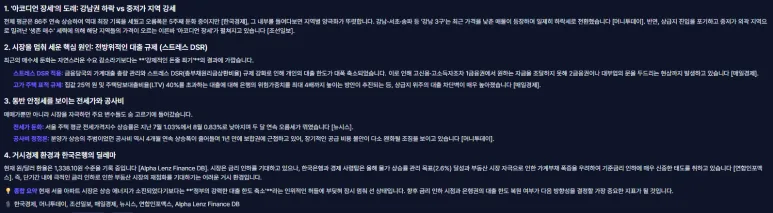 An analysis using AlphaLenz highlights an important point: investors should focus not only on the record-breaking duration of Seoul’s price growth, but also on changes in the forces driving that growth.
Key indicators include:
- The contrasting performance of Gangnam and lower-priced districts.
- The impact of lending restrictions, including stress DSR regulations.
- Interest rates and transaction volumes.
- Whether actual trading activity recovers.
By examining relevant news and macroeconomic indicators through AlphaLenz, investors can identify the key issues shaping Seoul’s complex real estate market. Rather than focusing only on the headline that “Seoul housing prices have risen,” it is important to examine how lending conditions, transaction volumes, and regional price trends are evolving across the city.