Nasdaq Hits a Record High: Why?
 Hello, this is Treasurer.
The Nasdaq has hit a new all-time high, surpassing its previous record close set on September 22.
Even with U.S. Treasury yields climbing to their highest level since 2002, strength in AI and tech stocks outweighed the pressure.
On October 5 (local time), all three major U.S. stock indexes closed higher.
- Nasdaq Composite: 27,477.31 (+286.45 pts, +1.05%).
This was a record close, and the intraday high of 27,544.07 was also a new record.
- S&P 500: 7,773.95 (+51.23 pts, +0.66%), close to its all-time high
- Dow Jones Industrial Average: 51,267.90 (+90.94 pts, +0.18%), closed higher
Yields are at their highest since 2002, yet stocks still rose.
How is that possible?
Source: The Herald Business
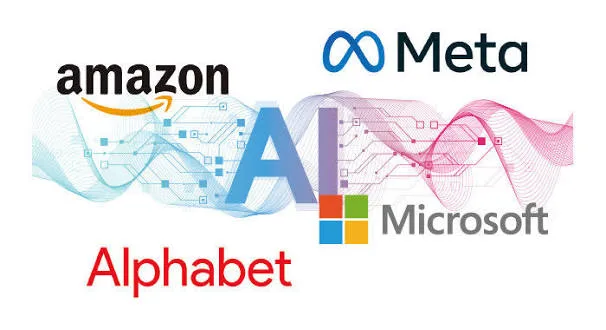
AI and Big Tech led the rally.
Nvidia rose 2.12%, posting a record close for the second straight day. It reached $240.10 during the session, which took its market capitalization to about $5.76 trillion (roughly KRW 7,824 trillion).
That leaves it about 4% short of the $6 trillion mark.
Microsoft (+1.48%), Meta (+1.90%) and Tesla (+2.20%) all moved higher, while SpaceX surged 7.63% to lead the gains. Semiconductor stocks were also strong across the board. TSMC rose 2.75% to a record high, and Broadcom gained 2.08%. The Philadelphia Semiconductor Index closed up 0.28%.
Is the AI strength real? What is the market betting on?
Source: Weekly Donga
Expectations for AI earnings growth outweighed the burden of high interest rates. The 10-year Treasury yield hit 5.34% intraday, its highest since 2002. Stocks still rose.
Weak jobs data also helped. September nonfarm payrolls rose by just 29,000, well below the roughly 84,000 expected. The odds of an October Fed rate hike fell from 70% to 24%.
Lower oil prices added support. After the G7 announced a 100-million-barrel reserve release, WTI fell more than 2% to the $89 range, and Brent eased to the $100 range. This raised hopes that inflation will cool.
Earnings optimism is also lifting the market. LSEG expects S&P 500 third-quarter earnings to grow more than 30% year over year, and Goldman Sachs forecasts 27% EPS growth. Analyst buy ratings on the S&P 500 are at a record 60%.
But do strong numbers alone mean it's time to buy?
Source: USA Today
A strong earnings outlook and whether that outlook is already priced are different.
The Nasdaq and the S&P 500 are trading near record highs, and Nvidia's market cap is approaching the $6 trillion threshold. Expectations are already high, so a pullback could follow if results fall short of them, even if those results are strong.
What investors should focus on is not simply whether earnings are good. The question is whether actual results meet or beat the market's high expectations. In particular, future share prices will depend on the gap between expectations and the guidance and next-quarter outlooks from major AI stocks.
Will the rally reach Korea? Korean markets reopened on October 6 after the holiday, and some observers expected AI momentum to lift Samsung Electronics and SK hynix. Key factors to watch are the Fed's September FOMC minutes, released October 7, and the third-quarter earnings season, which picks up next week.
Use AlphaLenz to see what to watch at markets' all-time highs.
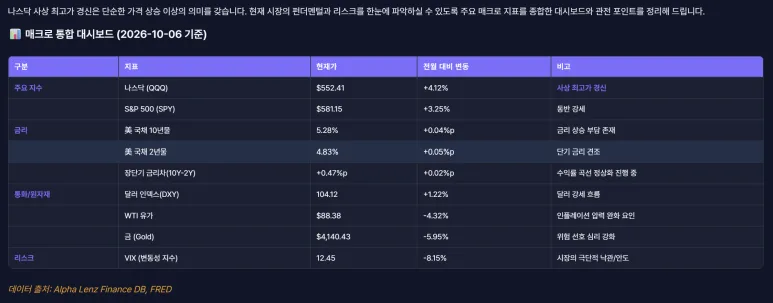
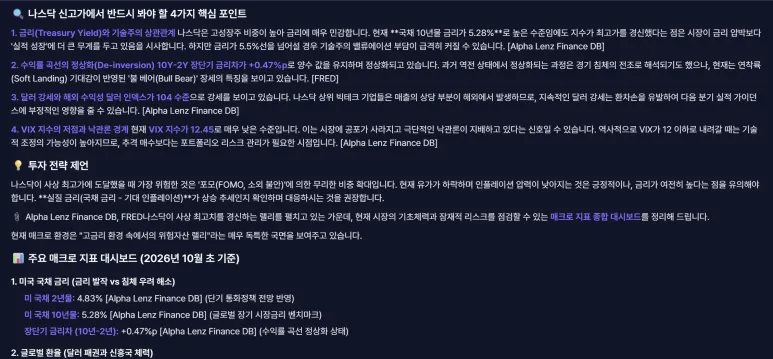 AlphaLenz Nasdaq Record-High Rally Analysis Screen
The Nasdaq has posted a record close and Nvidia's market cap is approaching $6 trillion. In this environment, confirming that "the market is doing well" is not enough. Investors need to track how actual earnings and guidance compare with current share prices, which already reflect high expectations.
AlphaLenz lets you monitor major U.S. stock indexes in real time on a single dashboard. It also shows key macro indicators such as Treasury yields, the U.S. Dollar Index, oil prices and the VIX. On the day the Nasdaq hit a new all-time high, both yields and stocks rose, which is unusual. AlphaLenz lets you examine from several angles what drove that move.
In the end, the record-high figure matters less than the trends behind it in interest rates, oil prices and employment. When you can see the indicators that move the market at a glance, you can also see what comes next.